24 hrs avg AQI
PM2.5 2.7X
Konsentrasi PM2.5 saat ini dalam Gurgaon adalah 2.7 times above batas yang direkomendasikan yang diberikan oleh nilai pedoman kualitas udara 24 jam WHO.
| LOKASI | Status | AQI-US | AQI-IN | PM2.5 | PM10 | Temp | Humid |
|---|---|---|---|---|---|---|---|
| Vikas Sadan Gurgaon | MODERATE | 61 | 40 | 17 | 40 | 34 | 59 |
| Dwarka | MODERATE | 59 | 42 | 16 | 42 | 34 | 62 |
| Nise Gwal Pahari | MODERATE | 59 | 40 | 16 | 40 | 31 | 63 |
| Bramprakash Ayurvedic Hospital | MODERATE | 68 | 52 | 20 | 52 | 36 | 57 |
| Arya Nagar | MODERATE | 76 | 57 | 24 | 57 | 36 | 57 |
| Teri Gram | POOR | 188 | 305 | 127 | 75 | 36 | 57 |
| National Institute Of Malaria Research | MODERATE | 85 | 115 | 27 | 123 | 36 | 57 |
| Sector 51 | POOR | 157 | 124 | 67 | 89 | 36 | 57 |
| Sector 2 Imt | MODERATE | 70 | 52 | 21 | 52 | 36 | 57 |
| Municipal Corporation Office | MODERATE | 59 | 32 | 16 | 16 | 36 | 57 |
| Masani | MODERATE | 93 | 53 | 32 | 23 | 36 | 57 |
| Ruchi Vihar | POOR | 132 | 95 | 48 | 95 | 36 | 57 |
| Aerocity | POOR | 124 | 101 | 45 | 102 | 36 | 57 |
| Najafgarh | GOOD | 40 | 43 | 9 | 43 | 36 | 57 |
| Vasant Kunj Sector C | POOR | 119 | 91 | 43 | 91 | 36 | 57 |
| Radhey Mohan Drive 2 | POOR | 162 | 153 | 76 | 106 | 36 | 57 |
| Mata mandir Road | POOR | 144 | 92 | 53 | 92 | 36 | 57 |
| DLF Phase 2 Sector 25 | POOR | 105 | 72 | 37 | 72 | 36 | 57 |
| DLF Phase 2 | MODERATE | 97 | 65 | 34 | 65 | 36 | 57 |
| DLF Phase 1 | POOR | 110 | 72 | 39 | 72 | 36 | 57 |
| Sushant Lok Phase 1 | MODERATE | 99 | 66 | 35 | 66 | 36 | 57 |
| Sector 6 Manesar | MODERATE | 95 | 57 | 33 | 57 | 36 | 57 |
| Sector 31 | POOR | 110 | 65 | 39 | 63 | 36 | 57 |
| Sector 42 | MODERATE | 97 | 65 | 34 | 65 | 36 | 57 |
| DLF Phase 5 | MODERATE | 97 | 65 | 34 | 65 | 36 | 57 |
| Sector 14 | MODERATE | 84 | 53 | 28 | 53 | 36 | 57 |
| Sector 59 | POOR | 154 | 109 | 61 | 114 | 36 | 57 |
| DLF Park Place | MODERATE | 97 | 64 | 34 | 64 | 36 | 57 |
| Sector 49 | POOR | 151 | 93 | 56 | 77 | 36 | 57 |
| Kanahi | MODERATE | 97 | 65 | 34 | 65 | 36 | 57 |
| Sector 57 | POOR | 156 | 117 | 65 | 86 | 36 | 57 |
| Vatika City | POOR | 154 | 107 | 62 | 82 | 36 | 57 |
| Sector 47 | POOR | 153 | 98 | 59 | 79 | 36 | 57 |
| Tikri | POOR | 151 | 93 | 56 | 75 | 36 | 57 |
| Sector 65 | POOR | 156 | 117 | 65 | 85 | 36 | 57 |
| Aravalli Park Nursery End | POOR | 115 | 75 | 41 | 75 | 36 | 57 |
| Aravalli Park Radhakrishna Mandir | POOR | 124 | 83 | 45 | 83 | 36 | 57 |
| Old sector 62 | POOR | 154 | 103 | 61 | 90 | 36 | 57 |
| Sector 28 | MODERATE | 95 | 65 | 33 | 65 | 36 | 57 |
| Sector 43 | MODERATE | 93 | 62 | 32 | 62 | 36 | 57 |
| Heritage One Tower A | POOR | 153 | 98 | 59 | 91 | 36 | 57 |
| Sector 56 | POOR | 117 | 70 | 42 | 68 | 36 | 57 |
| Belvedere Towers | POOR | 110 | 72 | 39 | 72 | 36 | 57 |
| The Laburnum | MODERATE | 93 | 62 | 32 | 62 | 36 | 57 |
| DLF 1 | MODERATE | 97 | 64 | 34 | 64 | 36 | 57 |
| The Aralias | MODERATE | 97 | 64 | 34 | 64 | 36 | 57 |
| Aravali Park Entrance | POOR | 117 | 76 | 42 | 76 | 36 | 57 |
| Sector 72 | POOR | 149 | 92 | 55 | 74 | 36 | 57 |
| Aravalli Park Middle | POOR | 122 | 79 | 44 | 79 | 36 | 57 |
| Sector 62 | POOR | 153 | 98 | 59 | 85 | 36 | 57 |
| HUDA Office GMDA | POOR | 102 | 60 | 36 | 58 | 36 | 57 |
| Tau Devilal Bio diversity Park GMDA | POOR | 124 | 75 | 45 | 69 | 36 | 57 |
| GMDA Leisure Valley Park | MODERATE | 91 | 61 | 31 | 61 | 36 | 57 |
| Sector 5 | MODERATE | 80 | 47 | 26 | 47 | 36 | 57 |
| Carterpuri GMDA | MODERATE | 82 | 51 | 27 | 51 | 36 | 57 |
| Cremeation Ground | GOOD | 50 | 37 | 12 | 37 | 39 | 38 |
| NASA AQCS 121 | POOR | 159 | 136 | 71 | 91 | 36 | 57 |
Waktu lokal
Wind speed
33 km/h
UV Index
16
Pressure
800 mb
Pakai Masker
Tetap di dalam ruangan
jendela
Gunakan Pemurni
Keluarga
AQI
AQI
AQI
AQI
AQI
AQI
AQI
Gurgaon
24 hrs avg AQI
Jawaban cepat untuk beberapa pertanyaan umum tentang polusi udara Gurgaon.
Kualitas udara waktu nyata di Gurgaon adalah 80 (POOR) AQI sekarang. Ini terakhir diperbarui 4 minutes ago .
Konsentrasi PM2.5 saat ini dalam Gurgaon adalah 41 (µg/m³). Organisasi Kesehatan Dunia (WHO) merekomendasikan 15 µg/m³ sebagai konsentrasi ambang batas PM2.5 selama 24 jam rata-rata. Saat ini, konsentrasinya adalah 1.64 kali batas yang disarankan.
Secara umum kualitas udara pada Gurgaon mulai memburuk pada akhir Oktober. Musim dingin adalah musim yang paling parah terkena polusi udara.
Anda harus memakai masker N95 yang baik saat Anda pergi ke luar ruangan Gurgaon sampai AQI membaik hingga kisaran sedang.
Orang yang pergi ke kantor harus menghindari kendaraan pribadi dan menggunakan transportasi umum atau carpooling.
(i) Penyebab utama polusi udara luar ruangan adalah partikel padat dan cair yang disebut aerosol & gas dari emisi kendaraan, aktivitas konstruksi, pabrik, pembakaran jerami & bahan bakar fosil, dan kebakaran hutan, dll.
(ii) Penyebab utama polusi udara dalam ruangan adalah gas berbahaya dari bahan bakar memasak (seperti kayu, limbah tanaman, arang, batu bara dan kotoran), lembab, asap jamur, bahan kimia dari bahan pembersih, dll.
Polusi udara dalam ruangan di Gurgaon sama berbahayanya dengan polusi luar ruangan, karena polusi udara masuk ke dalam rumah atau bangunan melalui pintu, jendela dan ventilasi.
Di Gurgaon , Anda harus menggunakan pembersih udara atau mesin udara segar di rumah atau kantor dalam ruangan dan menutup semua pintu, jendela dan ventilasi ketika indeks kualitas udara luar (aqi) di Gurgaon sangat tinggi. Ventilasi yang tepat sangat disarankan hanya jika kualitas udara luar ruangan membaik dan kisaran AQI sedang.
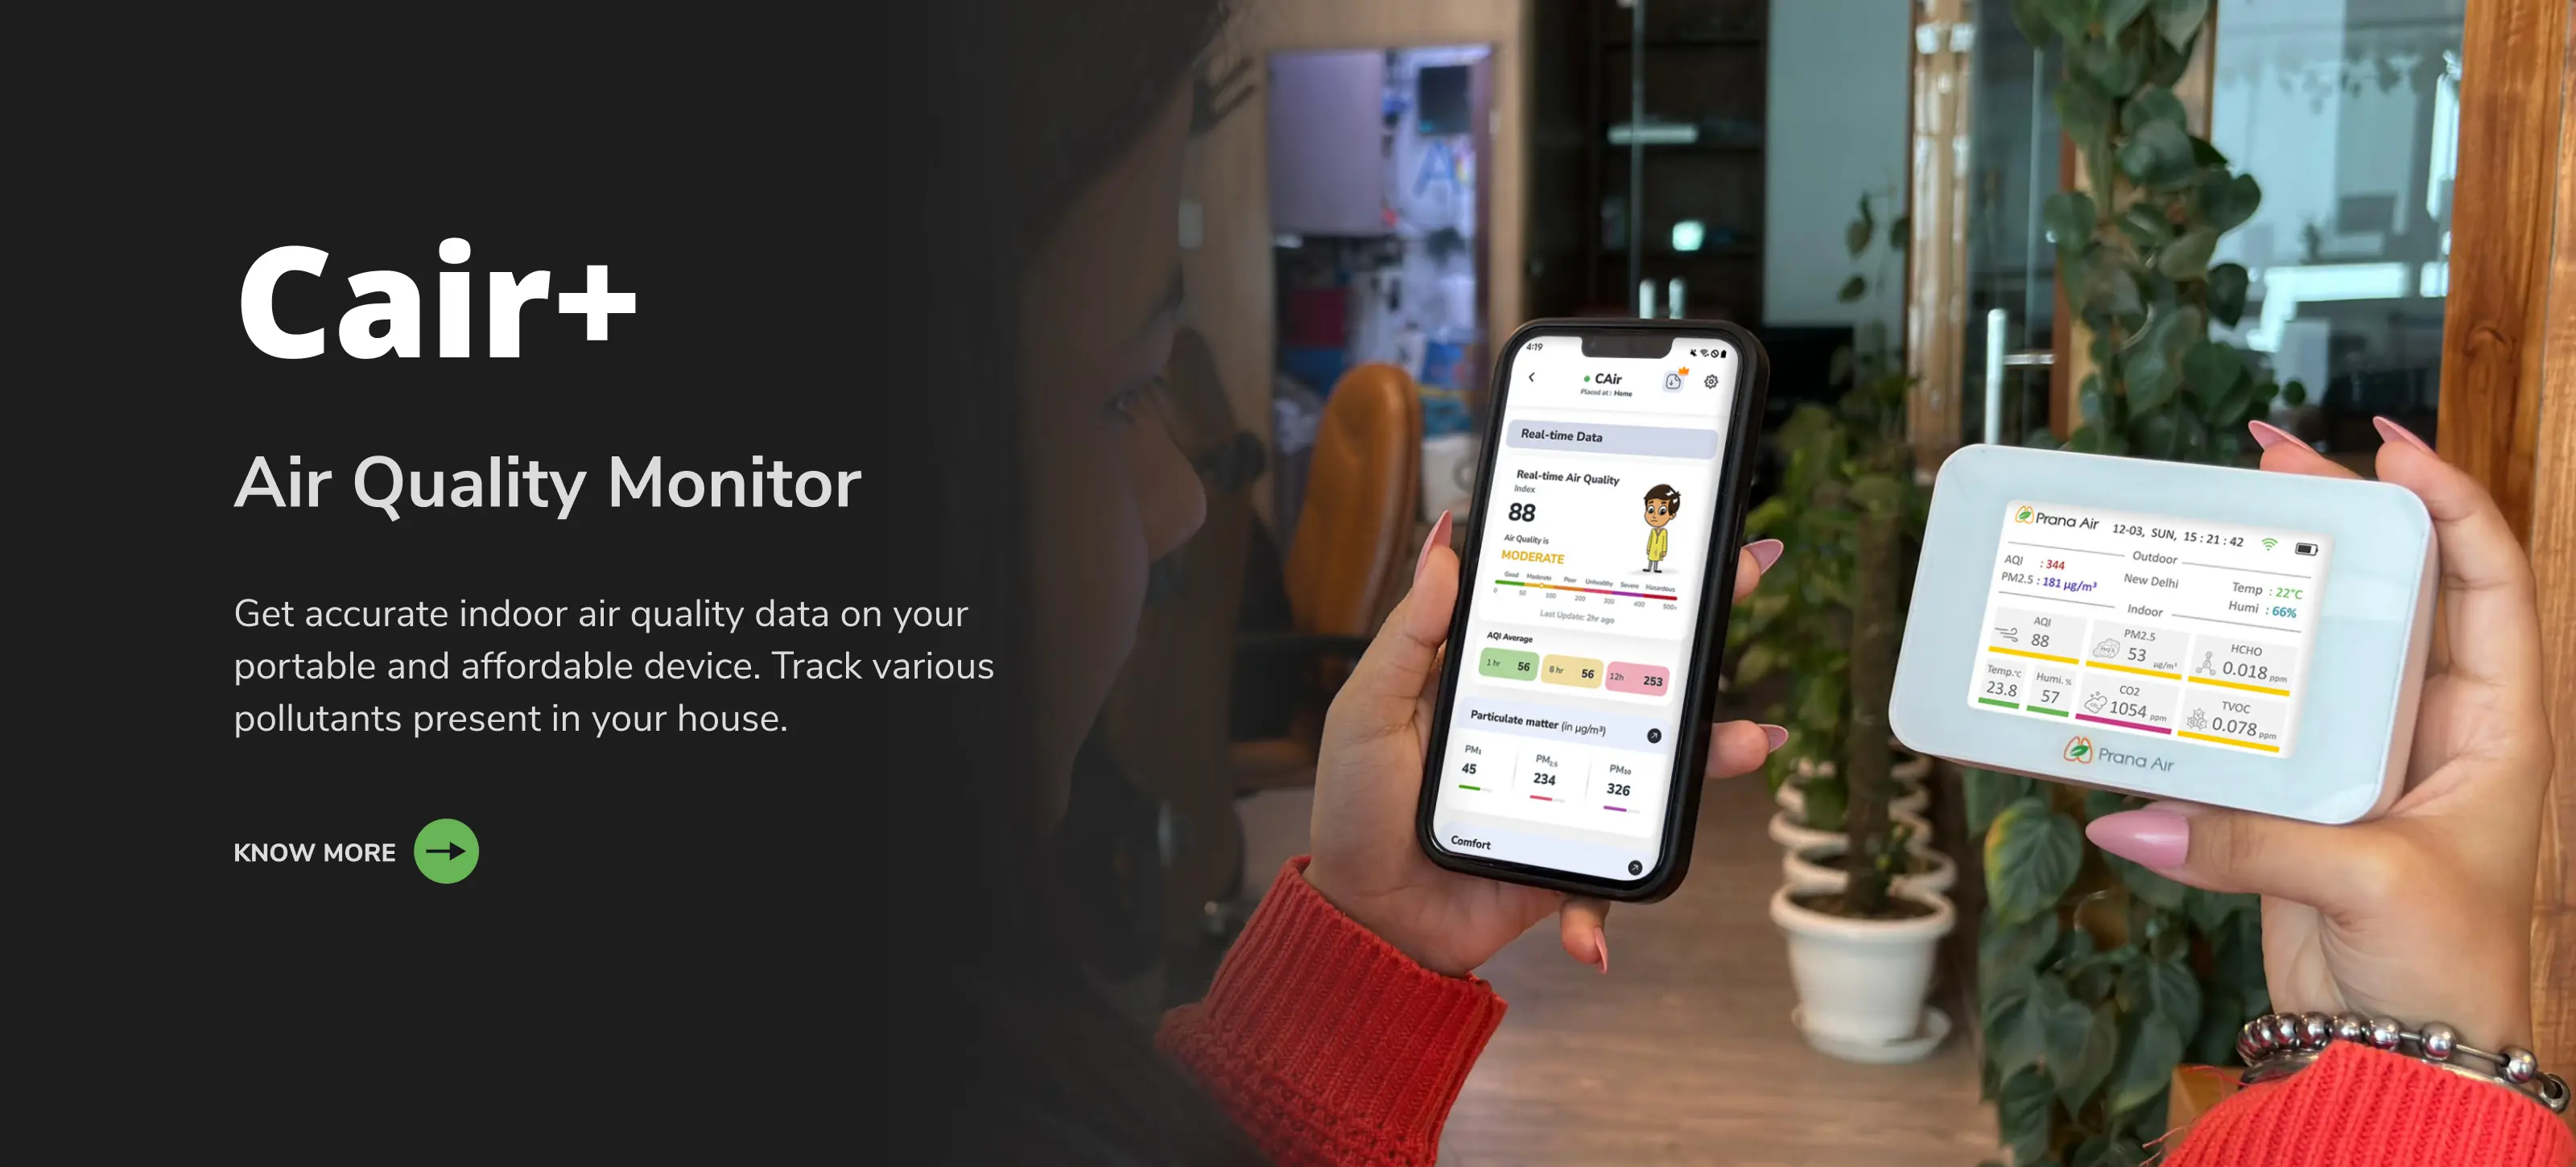
Cari tahu pemantau & solusi kualitas udara Prana Air untuk memerangi polusi udara di kota Anda.

Ketahui kualitas pernapasan Anda dengan monitor Prana Air (murah & akurat).

Analisis kualitas udara di mana saja dengan sensor gas & pm yang akurat & ringkas.

Bersihkan udara dalam ruangan Anda & bebaskan dari polusi udara dan racun dengan pembersih udara kami.

Pastikan Anda menghirup udara segar di dalam mobil dengan filter kabin mobil yang sangat efisien.

Hirup udara murni dengan masker bermotor Prana Air dari pemurnian filter hepa multi-layer.
Gurgaon, sometimes known as Gurugram, is a city in India's National Capital Region, near the Delhi-Haryana border. With an estimated population of 11,53,000, according to the 2011 Census of India, it is India's second-largest IT center and third-largest financial hub. Gurgaon is one of India's top five most polluted cities, as well as one of the world's top 30 most polluted cities. Air pollution has resulted from rapid population increase, and the situation is still deteriorating.
Gurgaon is one of India's most polluted cities due to a variety of air pollution sources. Listed below are a handful of them:
1. Vehicle Emissions: Gurgaon has the largest percentage of people who own a vehicle. The main source of air pollution in the city is vehicular emissions and traffic congestion. Pollutants such as ozone (which is created when hydrocarbons and nitrogen oxides react with sunlight and heat), carbon monoxide, particulates, hydrocarbons, nitrogen oxides, sulfur dioxide, and volatile organic compounds can be released.
2. Emissions from industries: Industrial emissions contribute 7%-9% of Gurgaon's air pollution. Oil burning produces major pollutants such as nitrogen oxides and sulfur, whereas coal combustion produces particle air pollution. When coal is utilized for combustion, the main pollutants created are nitrogen oxides, sulfur dioxide, and coal ash.
3. Diesel generator sets: Haryana government officials estimated that over 14,000 diesel generator sets are currently operational in Gurugram (2019). They contain carcinogens such as benzene, arsenic, and formaldehyde, which can cause cancer. There are also other severe environmental toxins present, such as nitrogen oxide, which depletes the ozone layer. According to a study published in 2018 by the Centre for Science and Environment (CSE), the usage of diesel generator sets enhances the concentration of Particulate matter in Gurgaon by 30%.
4. Thermal power plants: Coal-fired power plants are the most polluting industry in terms of SO2, accounting for around 67 percent of SO2 emissions in Delhi NCR. Thermal power plants emit pollutants such as nitrogen oxides, methane, sulfur oxides, co2, CFCs, and aerosols such as wood ash and soot.
5. Residential sources: Recent studies have found that residential emissions can contribute up to 50% of the measured particulate matter concentrations in an urban setting, resulting in significant annual mortalities in cities like Gurugram. Construction materials (insulation, roofing shingles, fire retardants, and so on), Biological Pollutants (bacteria, viruses, pet dander, mold, and so on), carbon monoxide, formaldehyde, nitrogen dioxide, lead, radon, particulate matter, smoke (wood and tobacco), volatile organic compounds (VOCs), and so on are some of the sources.
Exposure to air pollution leads to various short-term and long-term impacts on citizens' health. Air pollution also contributes to several mental health issues, including cognitive impairment, a higher risk of dementia, and a negative impact on baby neurogenesis.
● Gurgaon is one of the cities with a high ratio of people owning a car or vehicle to the total number of people. Vehicle emissions make people more vulnerable to respiratory ailments like pneumonia and bronchitis, aggravate asthma, and impair lung capacity.
● Birth defects, cancer, immune function abnormalities, kidney and liver dysfunction, lung and respiratory ailments, and neurotoxic disorders are all linked to industrial pollution.
● Irritation in the eyes, skin, and lungs, blood disorders, cancer, and skin lesions.
● Emissions from thermal power plants may lead to chest pain, lung damage, coughing, shortness of breath, throat irritation, worsen asthma, sleepiness, drowsiness, etc.
● Exposure to residential sources can increase one’s risk of developing lung disease, skin, eye, nose, and throat irritation, health issues with the nervous, cardiovascular, and reproductive systems, dizziness, unconsciousness, learning, and behavioral issues in children, respiratory diseases, central nervous system damage, health issues with the nervous, cardiovascular systems, and even deaths.
A study done by ARAI and TERI (2018) indicates that the transportation sector contributes 16-27 % and 14-23 % of PM2.5 and PM10 pollution, respectively, while the industrial sector contributes 13-30 % and 13-26 %, respectively. Dust, on the other hand, has a higher contribution to PM2.5 and PM10 pollution, ranging from 20 to 49 % and 23 to 52 %, respectively. Residential and other sources make up the rest of the contribution. This emphasizes the necessity for a multi-sectoral strategy for Gurgaon's air pollution problem.
The Central and State governments have issued numerous action plans and rules that apply to the air pollution in Gurgaon. At the city level, the Pollution Control Board plays an important role in pollution prevention and control. The following are some of the measures that aid in the reduction of air pollution:
1. The Ministry of Environment, Forests, and Climate Change (MOEFCC) has launched the National Clean Air Program (NCAP) across India.
2. The Gurgaon district administration recently drafted an action plan to reduce air pollution, which was implemented in October 2020.
3. Gurugram has joined up for the Cycles4Change Challenge organized by the Centre.
4. In 2017, the Graded Response Action Plan (GRAP) was notified for emergency action during periods of heavy pollution.
5. The Environment Pollution (Prevention and Control) Authority had been tasked by the Central Government with implementing GRAP in the NCR region (EPCA).
6. Pet-coke and Furnace Oil Bans: In 2017, the Supreme Court in Delhi, Haryana, Rajasthan, and Uttar Pradesh banned the use of petroleum coke and furnace oil for combustion.
7. NOx and SOx limits have been established.
Berikut adalah sumber daya teratas yang dapat Anda baca untuk mengetahui lebih lanjut tentang kualitas udara.
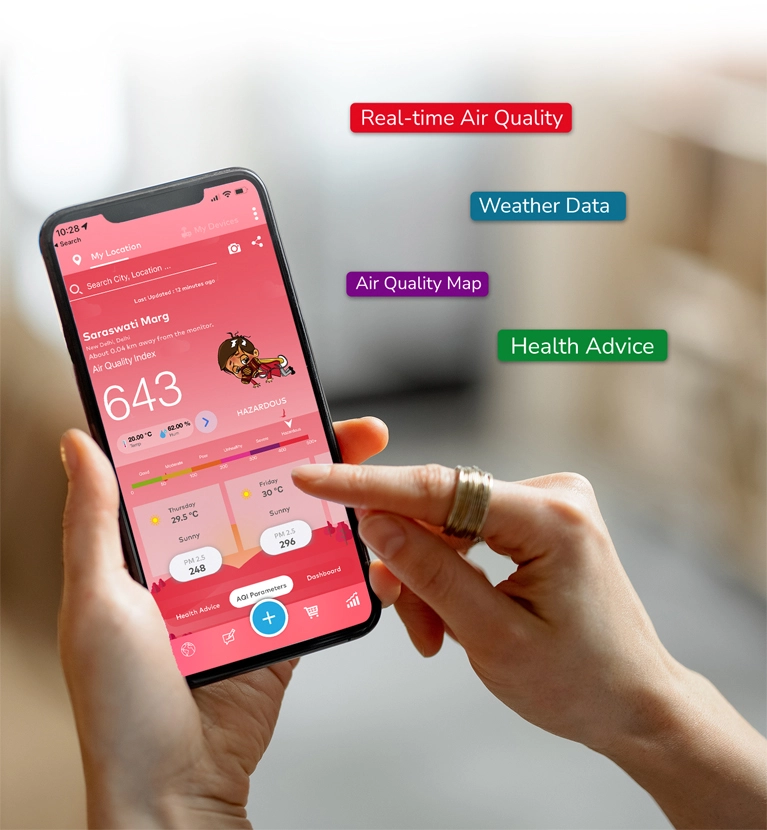
Ketahui apa yang Anda hirup dan kualitas udara di kota Anda dan lokasi terdekat. AQI real-time, peta, data cuaca & kebakaran, saran kesehatan dengan dasbboard yang berwawasan luas & analitis.