United States Air Quality Index (AQI) | Air Pollution
Real-time PM2.5, PM10 air pollution level in United States
Last Updated: 2025-11-22 07:22:29 AM (Local Time)


28 °C
ClearUnited States
Trending in United States
.png)
Dust vs Smoke: Why Cleaning Your Home Doesn’t Clean Your Air

What Our Politicians Breathe? Devices Reveal The Truth | Delhi Air Pollution | Ground Report
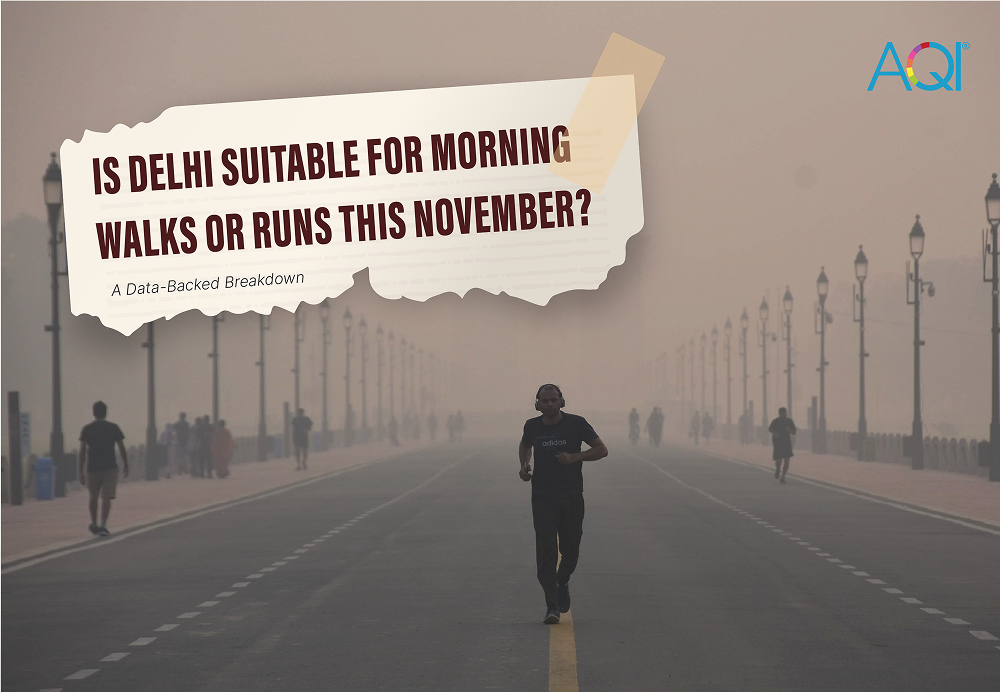
Is Delhi suitable for Morning Walks or Runs This November? A Data-Backed Breakdown
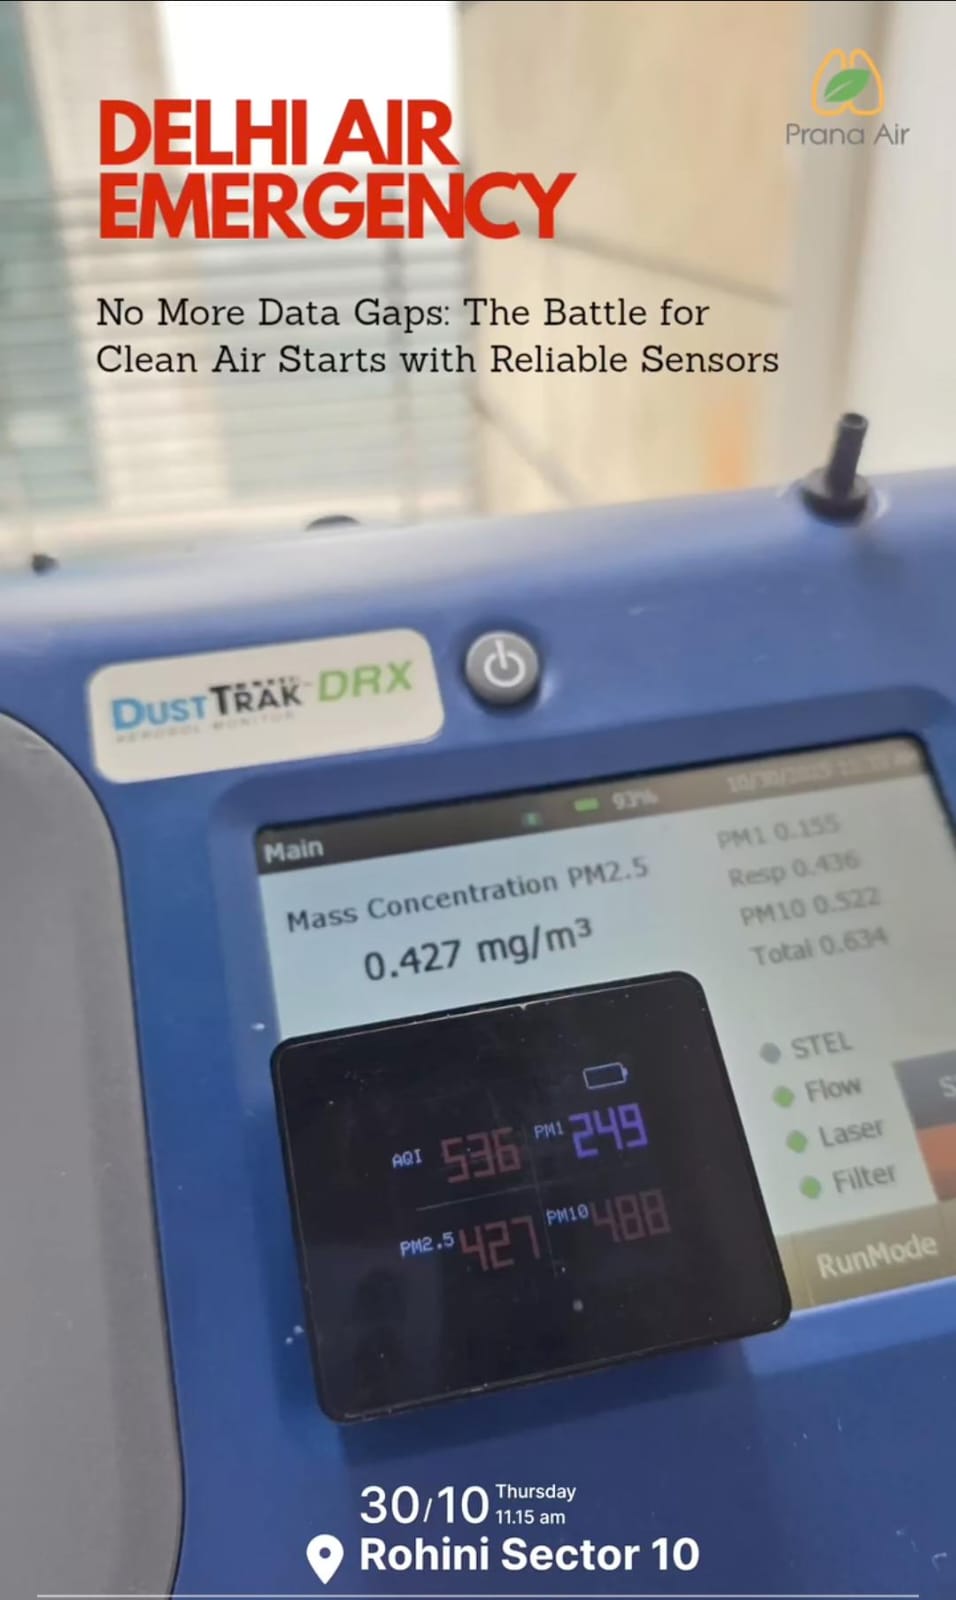
PM 2.5 Readings from TSI Dusstrak and Prana Air Pocket PM 2.5 Monitpr
-(1).png)
Why Every Smart Home in 2025 Needs a Smart Air Monitor
AQI Graph
Historical Air Quality Data
United States
Download 2024 Annual Data
World Air Quality Report

United States's States
Real-time Air Pollution Level
United States's Metro Cities
Air Quality Index


Most Polluted Cities 2025
United States
Analyze the real-time most air polluted cities in the country.
Standard Value
1.
Nogales, United States
2.
Mechanicsville, United States
3.
Chester, United States
4.
Highland Springs, United States
5.
Freemansburg, United States
6.
Bethlehem, United States
7.
Chesterfield, United States
8.
Brandermill, United States
9.
East Highland Park, United States
10.
Richmond, United States
Last Updated: 22 Nov 2025, 01:23 PM
AQI City RankingsAir Quality Solutions For United States
Explore the solutions of air quality monitoring & clean air.
Here are some applications that you can go through to find out the solutions.


United States's AQI Data Analytics Solutions
Air quality data monitoring platforms

Your area’s real-time data with detailed parameters.
Personalized health advice as per current AQI.
Analytical data to identify trends and conditions.
Connect and control your air quality devices.
Air Quality FAQs
at United States
Frequently Asked Questions About Air Quality
What is the current AQI level in United States?
The current real-time AQI level in United States is 44 (Good). This was last updated 2025-11-22 07:22:29 AM (Local Time).
When was the best AQI level in United States in the last 24 hours?
The best AQI level was 39 (Good) at 5:05 PM, Nov 21, 2025 (Local Time) during the last 24 hours.
When was the worst AQI level in United States in the last 24 hours?
The worst AQI level was 49 (Good) at 7:05 AM (Local Time) during the last 24 hours.
What is the current trend of AQI levels in United States during last 24 hours?
The AQI levels in United States have been fluctuating throughout the last 24 hours. The levels have increased by highest 49 at 7:05 AM (Local Time), lowest 39 at 5:05 PM, Nov 21, 2025 (Local Time).
What actions are recommended as per the current AQI level in United States?
The air quality is satisfactory, and air pollution poses little or no risk. No special precautions are needed; enjoy outdoor activities freely.
Recent AQI Blogs
Read the latest news
Here are some latest blogs that you can go through to find out more air pollution.